Climate and Weather

More like a cancer that needs to be kept in remission. Remember that great DOH episode where Jesse hears tell that the white supremacists are holding a rally in Hazzard County and he's like "Fought a war against those damn sonofabitch assholes. No way they're prancing down my street singing tikki torches at twilight". Picks up his chicken axe and heads off into town. For local color lets recall it as him picking up an ~ 2 ft piece of scrap cast iron pipe. An elbow welded on one end for some extra heft. One one side he's painted "this machine kills facists". Of course, on the other side it doesn't say nothing.
Im watching MLB and you're showing clips of 1965 little league semi finals..
Join the new century, EG.

Interesting, though.
I think I do see something printed on the other side of the pipe.
 
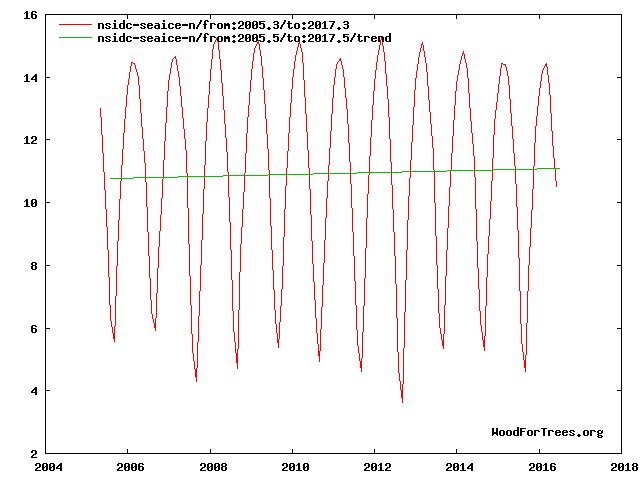
Arctic sea ice minimums 2005 to 2017
DJOiFKxXoAA-bVo.jpg
short term force trend.jpg

Games with short term data.
 
What caused the giant warming peak 120,000 years ago?
What caused it to get colder again?
Why are the cycles so uniform over the last 400,000 years?

"Down in Joe's garage we didn't have no dope or LSD just a couple of quarts of beer would fix it so the intonation would not offend the ear and the same old chords going over and over...."

Post 742 I believe. Not just ∆°C. ∆°C/∆t.
 
use these forums as a creative writing excercise...

Arguably the best we can hope for really. I mean look at it. Wheels are off the bus, standing by the side of the road. Smoking up the last of Izzy's high grade organic fuel that he got from his brother in law and waiting for the tow truck to show up.
 
What pattern do you see developing? (since beginning of thread)
Strictly your personal perspective.

Do you consider any other data sources, just out of curiosity?

Pattern from the GISTEMP data? Like I posted at some other point, the decadal anomaly data spanning mid 1960's to present fits pretty well to

y = 0.5SIN(6.26x) + 0.028x, y in °C and x in years starting graphing sequence at x = 0.

That describes the pattern. How do you think the first term of the equation means for the data profile? What about the second term?

Other data sources? For anomaly records I check out HadCrut every once in a while. I've been looking at the Huntsville group's data more frequently lately. If you're looking for a red team blue team excercise read the history of the Berkeley Earth Project. GISTEMP, however, is a great swinging breath for the koan.

My old house north of the 610 loop in Houston escaped the worst of Harvey, so that was good to hear. Just a blip.
 
What pattern do you see developing? (since beginning of thread)
Strictly your personal perspective.

Do you consider any other data sources, just out of curiosity?
There's no getting through Gore followers. Ask them to explain past Ice Ages and their eyes glaze over... " but look, I have this chart!"
 
I think this is cute. Science no longer consider it a debate so the nutters on a soccer blog are debating the science. Hey, can we talk about the validity of e=mc2 next? Or gravity?
 
There's no getting through Gore followers. Ask them to explain past Ice Ages and their eyes glaze over... " but look, I have this chart!"

What would past Ice Ages have to do with a current discussion on AGW?

The question has never been, does Climate change over time. The question is, how much is man contributing to the current unusual spike up in Global temperature (since the industrial revolution starting pumping carbon into the atmosphere) and what are the consequences?

One can get a non-scientific but nonetheless technically interesting look at the degree of human influence versus possible natural warming processes by recognizing a couple of things --
1) Most human sources of CO2 are in the northern hemisphere, and
2) because of global wind patterns, especially the winds known as the trade winds, the northern and southern atmosphere components are partially isolated from each other.
That has resulted in a lag of CO2 concentration as measured in the south compared with the north. One might expect, then, that regardless of any natural background warming process (sunspots, volcanoes, eetc), if atmospheric CO2 is the driver, the north would be warming faster than the south.

Fig.B.gif
 
What would past Ice Ages have to do with a current discussion on AGW?

The question has never been, does Climate change over time. The question is, how much is man contributing to the current unusual spike up in Global temperature (since the industrial revolution starting pumping carbon into the atmosphere) and what are the consequences?
I suppose the next question would be can anything of significance be done by man to alter climate change? What is one willing to forsake in the name of climate change?
 
I suppose the next question would be can anything of significance be done by man to alter climate change? What is one willing to forsake in the name of climate change?

The biggest change with respect to reducing anthropogenic CO2 production in current technology is converting coal-powered electrical plants to operate on other fuels (usually natural gas), or replacing them altogether with renewable electrical energy sources (wind and solar predominate). What we are "forsaking" in that case is air pollution.
 
What would past Ice Ages have to do with a current discussion on AGW?

The question has never been, does Climate change over time. The question is, how much is man contributing to the current unusual spike up in Global temperature (since the industrial revolution starting pumping carbon into the atmosphere) and what are the consequences?
Got that ratio yet?
 
Back
Top