Climate and Weather

The biggest change with respect to reducing anthropogenic CO2 production in current technology is converting coal-powered electrical plants to operate on other fuels (usually natural gas), or replacing them altogether with renewable electrical energy sources (wind and solar predominate). What we are "forsaking" in that case is air pollution.
or Nuclear Power
 
or Nuclear Power

Nuclear power is pollution-free when properly operated (ignoring fumbles like Chernobyl, 3-Mile Island, Fukushima, Detroit Fermi, etc) but still has a long-term waste storage and isolation problem. Perhaps t can overcome the politics that has kept the completed Yucca Mountain repository empty.
 
Arguably the best we can hope for really. I mean look at it. Wheels are off the bus, standing by the side of the road. Smoking up the last of Izzy's high grade organic fuel that he got from his brother in law and waiting for the tow truck to show up.
French Frie exhaust always gets the appetite going.
 
Pattern from the GISTEMP data? Like I posted at some other point, the decadal anomaly data spanning mid 1960's to present fits pretty well to

y = 0.5SIN(6.26x) + 0.028x, y in °C and x in years starting graphing sequence at x = 0.

That describes the pattern. How do you think the first term of the equation means for the data profile? What about the second term?

Other data sources? For anomaly records I check out HadCrut every once in a while. I've been looking at the Huntsville group's data more frequently lately. If you're looking for a red team blue team excercise read the history of the Berkeley Earth Project. GISTEMP, however, is a great swinging breath for the koan.

My old house north of the 610 loop in Houston escaped the worst of Harvey, so that was good to hear. Just a blip.
Your plot.
What pattern do you see since the beginning of the thread?
You highlighted them, so I figured you'd give us a run down on the warming.
Can you elucidate on the catastrophic warming during your highlighted thread projector?

I said all of that with a totally straight face.
 
Arguably the best we can hope for really. I mean look at it. Wheels are off the bus, standing by the side of the road. Smoking up the last of Izzy's high grade organic fuel that he got from his brother in law and waiting for the tow truck to show up.
The tow truck was worse. Smelled like Fish n Chips with Vineagar.
 
Your plot.
What pattern do you see since the beginning of the thread?
You highlighted them, so I figured you'd give us a run down on the warming.
Can you elucidate on the catastrophic warming during your highlighted thread projector?

I said all of that with a totally straight face.
Catastrophy is of no importance to Totalitarian climate policy experts. Consumption is the only thing that matters. Just ask Leonardo.
 
Been trying to learn the finger picking sequence for Sound of Silence. My big fingers have a hard time on the part getting from modified C to G and back again quickly. But its fun. For the beginner, I find this lady's videos to be very helpful.

C to G is easy. Two fingers more or less on the switch.
 
There's no getting through Gore followers. Ask them to explain past Ice Ages and their eyes glaze over... " but look, I have this chart!"

To my understanding there are two main schools of thought on long term cycles that likely underlie climatic transitions such as moving from one interglacial period to the next. One has to do with the asymmetries in Earth's orbit around the sun. The other has to do with release of aerosols from the Earth's interior due to volcanism or super plume events. These may be cyclic due to slow thermal convection within the mantle.

There is lots of information online on both these forcings.

Everyone's experience is different I suppose. Mine is that questions come up pretty easy and the glazing comes when the answers are found to be difficult or require effort.
 
So how about a chart showing the last 6k years? Or 10k? How would that look?

Since you asked, some back and forth on a 400,000 year reconstruction based on isotope proxies can be found in posts ranging like 625-675 ish. Here's a portion of that sequence that I don't recall if I ever uploaded that spans about -20 K before present. Doesn't look like I stuck axes labels on by the y-axis is temp anomaly relative to a point within the proxy data. The red points at the end are instrumentation data from 1880 to present.

Present.jpg
 
What would past Ice Ages have to do with a current discussion on AGW?

Quite a bit actually. As has been pointed out before and will doubtlessly be pointed out again, it is not possible to do a climate "experiment" +/- humans as a variable on the planet. In triplicate no less. So conceptually the approach with AGW is a modeling approach, and is it just one facet of a broader effort to understand the factors that cause climate to be as dynamic-on a geologic timescale-as it is. If you can identify the natural forces that cause climatic events like ice ages, for example, and quantify them, you can ask whether our current warming trend can be explained without some additional variable that needs to be plugged into the equation.
 
While there were never more than 3 Stooges in any film or vaudeville stage, they were drawn over the years from Moe, Shemp, Larry, Curly, Joe, Fake Shemp Joe, Curly Joe and Fake Larry Emil, so you still have room for Izzy, the plumber, nosport, and two players to be named later.

You seemed to have gone beyond enjoying their humor and have become a staunch follower....

Explains your thinking process....
 
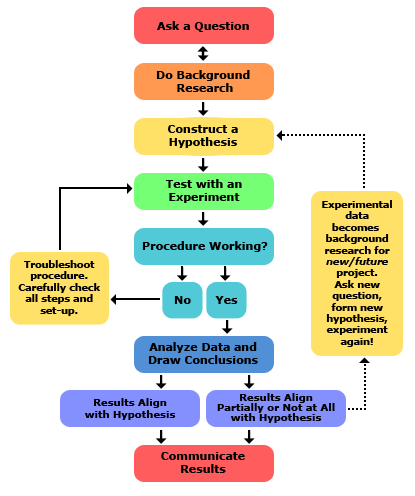
2013-updated_scientific-method-steps_v6_noheader.png


Science
1) Identify problem
2) Solve problem.
3) Tell me how you solved the problem.
4) Yes, it matters how good you are.


That research looks quite familiar........................
 
To my understanding there are two main schools of thought on long term cycles that likely underlie climatic transitions such as moving from one interglacial period to the next. One has to do with the asymmetries in Earth's orbit around the sun. The other has to do with release of aerosols from the Earth's interior due to volcanism or super plume events. These may be cyclic due to slow thermal convection within the mantle.

There is lots of information online on both these forcings.

Everyone's experience is different I suppose. Mine is that questions come up pretty easy and the glazing comes when the answers are found to be difficult or require effort.
Like when I ask Wez for the AGW ratio?
 
Back
Top