Yous some lying muthafuckas,
Delingpole: NOAA Caught Adjusting Big Freeze out of Existence
5263
Email
Google+
Twitter
AP/Charles Rex Arbogast
by
James Delingpole20 Feb 2018
565
20 Feb, 2018 20 Feb, 2018
The National Oceanic and Atmospheric Administration (NOAA) has yet again been caught exaggerating ‘global warming’ by fiddling with the raw temperature data.
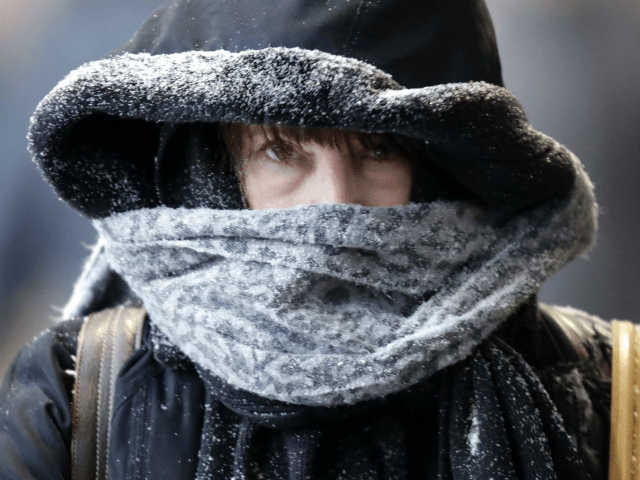
This time, that data concerns the recent record-breaking cold across the northeastern U.S. which NOAA is trying to erase from history.
If you believe NOAA’s charts, there was nothing particularly unusual about this winter’s cold weather which caused
sharks to freeze in the ocean and iguanas to drop out of trees.
Here is NOAA’s January 2018 chart for Northeast U.S. – an area which includes New England along with NY, PA, NJ, DE and MD.
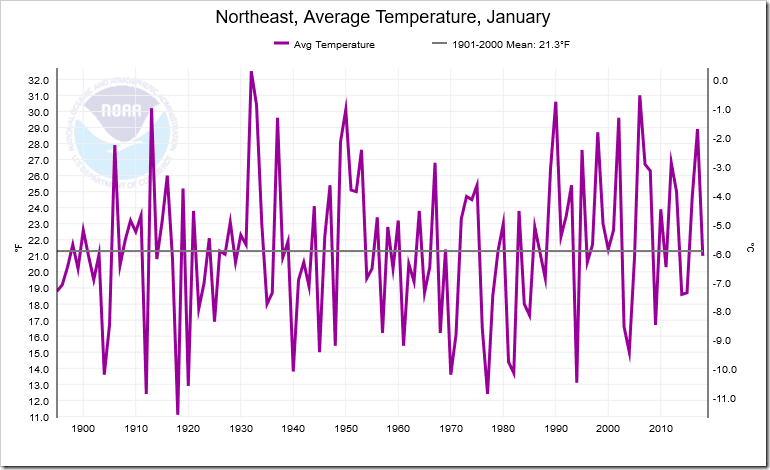
You’d never guess from it that those regions had just experienced record-breaking cold, would you?
advertisement
That’s because, as
Paul Homewood has discovered, NOAA has been cooking the books. Yet again – presumably for reasons more to do with ideology than meteorology – NOAA has adjusted past temperatures to look colder than they were and recent temperatures to look warmer than they were.
We’re not talking fractions of a degree, here. The adjustments amount to a whopping 3.1 degrees F. This takes us well beyond the regions of error margins or innocent mistakes and deep into the realm of fiction and political propaganda.
Homewood first smelt a rat when he examined the
New York data sets.
He was particularly puzzled at NOAA’s treatment of the especially cold winter that ravaged New York in 2013/14, which he describes here:
The cold weather really began on Jan 2nd, when an Arctic front descended across much of the country, and extended well into March.
The NWS wrote at the end of the winter:
The winter of 2013-14 finished as one of the coldest winters in recent memory for New York State. Snowfall across Western and North Central New York was above normal for many areas, and in some locations well above normal. This winter comes on the heels of two previous mild winters, making the cold and snow this winter feel that much harsher.
Temperatures this winter finished below normal every month, and the January through March timeframe finished at least 4 degrees below normal for the two primary climate stations of Western New York (Buffalo and Rochester)…..
Relentless cold continued through the month of January across the region.
So why, he wondered, did NOAA have this marked down as only the 30th coldest winter (since 1895) on its New York State charts, with a mean temperature of 16.9F?
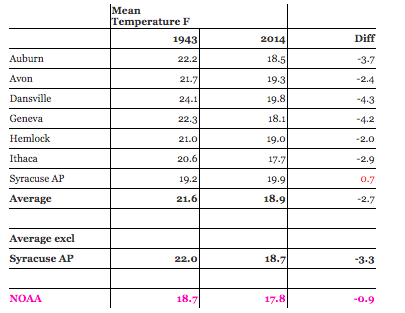
Homewood compared the local records for January 1943 and January 2014 – months which, according to NOAA’s charts, had very similar average temperatures.
What he found was that NOAA’s charts were deeply inaccurate. The 2014 local temperatures had been adjusted upwards by NOAA and the 1943 local temperatures downwards.
He concludes:
On average the mean temperatures in Jan 2014 were 2.7F less than in 1943. Yet, according to NOAA, the difference was only 0.9F.
Somehow, NOAA has adjusted past temperatures down, relatively, by 1.8F.
Now, Homewood has given the
same treatment to the most recent Big Freeze – the winter of 2017/2018.
Yet again, he has found that NOAA’s arbitrary adjustments tell a lie. They claim that January 2018 was warmer in the New York region than January 1943, when the raw data from local stations tells us this just isn’t true.
So at the three sites of Ithaca, Auburn and Geneva, we find that January 2018 was colder than January 1943 by 1.0, 1.7 and 1.3F respectively.