Late Pleistocene warming pre-SUV hysteria.
https://www.google.com/url?sa=t&rct...438.full.pdf&usg=AOvVaw2dswjGqMY6BD1kiDEYjzWX
https://www.google.com/url?sa=t&rct...438.full.pdf&usg=AOvVaw2dswjGqMY6BD1kiDEYjzWX
Son of e-reader.Unfortunately for nutters, we have 343 pages here, of proof you idiots flunk Science.
Thought I was already "out" lol.Strike 4.
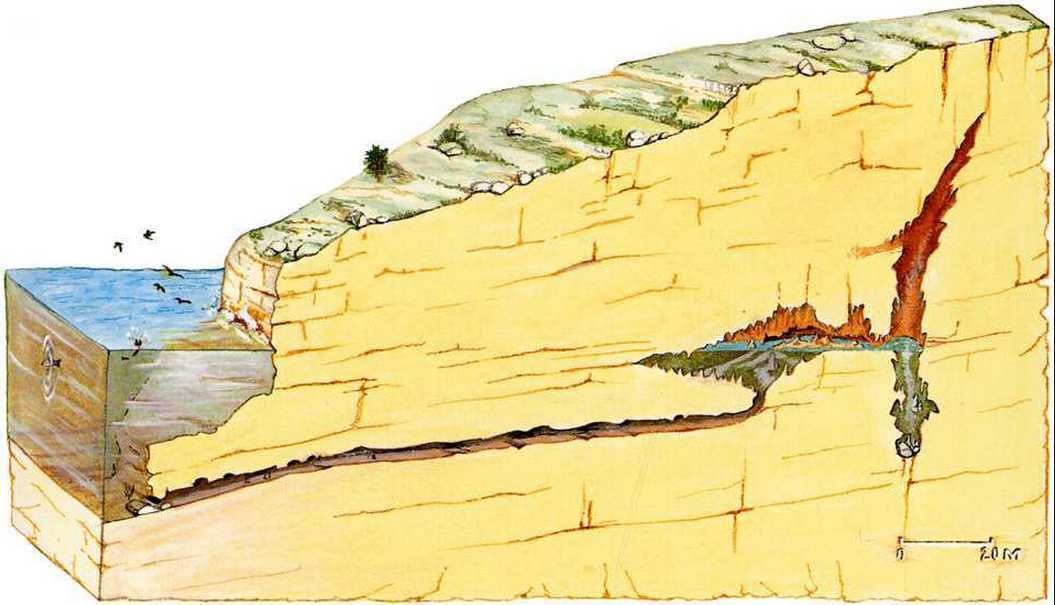
The illustration above is a cut away rendering of the Cosquer cave in Southern France.
The cave entrance is 37 meters below sea level today.
18,500 years ago, people entered the cave by foot, and painted images of animals on the cave walls.
37 meters = 37000 millimeters.
If you divide 37000 by 18500, you get 2.
2 millimeters per year average sea level rise.
The 20th century sea level average rise per year was 1.8 millimeters.
btw, I came up with this on my own.lol.
I wasnt looking for it, just used it to escape a short faced bear on one of my youthful wooly rhinoceros hunts.You discovered the cave?
The illustration above is a cut away rendering of the Cosquer cave in Southern France.
The cave entrance is 37 meters below sea level today.
18,500 years ago, people entered the cave by foot, and painted images of animals on the cave walls.
37 meters = 37000 millimeters.
If you divide 37000 by 18500, you get 2.
2 millimeters per year average sea level rise.
The 20th century sea level average rise per year was 1.8 millimeters.
btw, I came up with this on my own.lol.
My math is perfect.But it wasn't a simple ramp. Sea level came up relatively rapidly ("relatively" as in several thousand years) as the ice age melted off and then stabilized about 1 meter below present levels about 7000 years ago.
1 meter = 1000 millimeters.
If you divide 1000 by 7000 (about the length of time since the last post-ice-age meltoff stabilized), you get 0.14.
0.14 millimeters per year average sea level rise.
The 20th century sea level average rise per year was 1.8 millimeters.
What follows is a reference to an actual scientific article with data to back up what I just posted.
http://people.rses.anu.edu.au/lambeck_k/pdf/204.pdf
My math is perfect.
The average over 18500 yrs is 2 millimeters.
The 20th century average is 1.8 millimeters.
We agree.
Ive stated all along that there are drastic swings in climate over sometimes very short periods.
The average is just that. an average.
What did I get wrongClueless.
What did I get wrong
It is, only as a means of presenting 20th century sea level rise as well, ..average.That the "average" is meaningful in this discussion.
It is, only as a means of presenting 20th century sea level rise as well, ..average.
Who painted the pictures on the cave walls in Cosquer.Within the period of written human history, it is not.
Im tired of slapping you around.
I got shit to do.
Who painted the pictures on the cave walls in Cosquer.
Lol! You don't even read the articles you link.You could start with reading the article I linked. All you need to do is look at the pictures to get the point.
I'm reading some stuff on prehistoric cave art in France, and I see this cutaway of the cave at Cosquer.Lol! You don't even read the articles you link.