Kante
PREMIER
Here’s data on the most improved - and least improved – u15 SoCal teams in 2018-19 through May 19th.
Similar to the u13 and u14 improvement/decline posts, the goal of this post is - as the season’s coming to a close, and clubs and families are making decisions about next year - to provide some objective info for evaluating DA team improved or decline over time, relative to other teams in their group.
Will leave it to the clubs and families to interpret on whether or not the improvements or declines were due to actual player development (i.e. good or bad coaching) or other reasons.
If your team is not listed below or is another age group but you are interested in how they’re doing, send a note and will send over the requested team chart(s).
The methodology for calc’ing the goal differential % that is used to measure progress over time is discussed at the end of the post
Most Improved u15 #1: Real SoCal
Real SoCal have been a story of very consistent improvement over the season on both sides of the ball.
Ironically, strong showings in late September/early October against good teams – vs #1 TDS-ranked LAFC and vs #18 TDS ranked Nomads – plus a very strong match against Barca almost obscured Real SoCal’s progress.
But, taking those matches out of the equation, u15 Real SoCal was almost 3x better by May 19th than they were at the beginning of the season with consistent progress almost every week explaining close to 50% of the improvement, which is remarkable.
RSC’s best performances came in a 7-2 home win over Barca and a 2-0 home win against Albion.
Game 10 – a 0-5 loss to the Strikers – seemed to be the key turning point for RSC, with both the offense and defense getting significantly better after that match.
Here’s the u15 Real SoCal goal differential % over time chart:

Most Improved u15 #2: Barca
Barca has been up and down all year but the trend line over time has been in the right direction with Barca playing about 2x better by May 19th than they were playing at the beginning of the season.
Their best performances were a 2-0 home win against Albion and a 5-2 home win against SD Surf. However, in keeping with their up and down over the season, a couple of games after those solid wins, Barca then turned in their worst performances of the season with 2-7 away loss to RSC.
This loss, however, seems to be the key turning point for Barca with both their offense and defense improving significantly after that point.
Here’s u15 Barca’s goal differential % over time chart:

Most Improved u15 #3: Arsenal
Arsenal had a tough start to the season, losing their first three games by a combined 1-16 margin against Barca, SD Surf and De Anza. After that, Arsenal started to improve significantly but peaked and then plateaued after 14 games with a 2-2 tie in their February rematch against SD Surf (Arsenal lost the first match 0-10 at the beginning of the season).
But Arsenal’s defense drove Arsenal’s overall improvement with consistent week to week progress and by May 19th was playing about 2x better than they were at the beginning of the season.
Here’s the u15 Arsenal goal differential % over time chart:

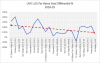
Least Improved u15 #1: LAFC
What?!!?
Yes, LAFC is the least improved u15 team in SoCal.
To be fair, some of it is that they’ve been playing u14s up with the u15 team, particularly in the second half of the season. But, looking at the numbers, more than 40% of the overall downward trend was driven by a week over week decline on the offensive side.
This trend was at its worst in a four-game stretch that ran from late January through the end of March and was bookended by a 1-1 tie against the Nomads on January 26th in game 12 and 2-0 win to RSC in game 15 on March 2nd.
LAFC’s offense bottomed out with the 0-2 loss to FCG on March 23rd, and after that point, the offense took a significant step up for the next four games, with LAFC outscoring opponents 20-2.
But, even with that late improvement, LAFC’s offense - playing about 4x worse by May 19th – outweighed LAFC’s consistently good defense and resulted in LAFC being about 2.5x less competitive overall than they were at the beginning of the season.
Here’s the u15 LAFC goal differential % over time chart:

Since this is likely controversial, am also including the u15 LAFc goal scoring % over time (i.e. offense effectiveness) chart:

Least Improved u15 #2: LA Galaxy San Diego
LAGSD actually had solid improvement in the 2018 part of the season, peaking with a 3-2 win over LAUFA in mid-November. The improvement was driven primarily by significant progress on the offensive side of the ball, with the start of the improvement coming after after their sixth match, a 0-3 loss to the Strikers. LAGSD also had some improvement defensively in that same time period.
After LAGSD returned from the winter break, it was a different story, and LAGSD’s offense and defense gave back their improvements and both returned to their poor previous form.
As of May 19th, LAGSD was about 2x less competitive relative to their peers than they were at the beginning of the season.
Here’s the u15 LAGSD goal differential % over time chart:

Least Improved u15 #3: San Diego Surf
San Diego Surf started very strong with a 10-0 win over Arsenal but then immediately followed that with 1-1 tie against LAUFA. And so their season went…
If the win against Arsenal is not included, the SD Surf are a story of improvement that peaked in late March, with a 4-1 win over De Anza, that was then followed by a sustained decline in performance in April and May. Both the improvement and decline were driven primarily by a similar improvement and then decline on the offensive side.
Defensively, the SD Surf was consistent for most of the season with a 2-5 loss to Barca being the most significant outlier.
It should be noted that then SD Surf coach Benoit David announced his departure from the Surf club to join LAFC at the end of February. Although SD Surf looks like they initially shrugged off the announcement, it’s reasonable to assume that the announcement had an impact.
As of May 19th, the SD Surf was about 50% less competitive relative to their peers than they were at the beginning of the season.
Here’s the u15 SD Surf goal differential % over time chart:

__________
Here’s the short version on the methodology for comparing teams. It’s the same algo being used to predict match results can also be used to track team progress relative to their peer group over time.
This progress tracking is calculated as:
minus
equals
If there’s a need for/interest in more detail or other questions, just ping over or reply to this post.
Similar to the u13 and u14 improvement/decline posts, the goal of this post is - as the season’s coming to a close, and clubs and families are making decisions about next year - to provide some objective info for evaluating DA team improved or decline over time, relative to other teams in their group.
Will leave it to the clubs and families to interpret on whether or not the improvements or declines were due to actual player development (i.e. good or bad coaching) or other reasons.
If your team is not listed below or is another age group but you are interested in how they’re doing, send a note and will send over the requested team chart(s).
The methodology for calc’ing the goal differential % that is used to measure progress over time is discussed at the end of the post
Most Improved u15 #1: Real SoCal
Real SoCal have been a story of very consistent improvement over the season on both sides of the ball.
Ironically, strong showings in late September/early October against good teams – vs #1 TDS-ranked LAFC and vs #18 TDS ranked Nomads – plus a very strong match against Barca almost obscured Real SoCal’s progress.
But, taking those matches out of the equation, u15 Real SoCal was almost 3x better by May 19th than they were at the beginning of the season with consistent progress almost every week explaining close to 50% of the improvement, which is remarkable.
RSC’s best performances came in a 7-2 home win over Barca and a 2-0 home win against Albion.
Game 10 – a 0-5 loss to the Strikers – seemed to be the key turning point for RSC, with both the offense and defense getting significantly better after that match.
Here’s the u15 Real SoCal goal differential % over time chart:
Most Improved u15 #2: Barca
Barca has been up and down all year but the trend line over time has been in the right direction with Barca playing about 2x better by May 19th than they were playing at the beginning of the season.
Their best performances were a 2-0 home win against Albion and a 5-2 home win against SD Surf. However, in keeping with their up and down over the season, a couple of games after those solid wins, Barca then turned in their worst performances of the season with 2-7 away loss to RSC.
This loss, however, seems to be the key turning point for Barca with both their offense and defense improving significantly after that point.
Here’s u15 Barca’s goal differential % over time chart:
Most Improved u15 #3: Arsenal
Arsenal had a tough start to the season, losing their first three games by a combined 1-16 margin against Barca, SD Surf and De Anza. After that, Arsenal started to improve significantly but peaked and then plateaued after 14 games with a 2-2 tie in their February rematch against SD Surf (Arsenal lost the first match 0-10 at the beginning of the season).
But Arsenal’s defense drove Arsenal’s overall improvement with consistent week to week progress and by May 19th was playing about 2x better than they were at the beginning of the season.
Here’s the u15 Arsenal goal differential % over time chart:
Least Improved u15 #1: LAFC
What?!!?
Yes, LAFC is the least improved u15 team in SoCal.
To be fair, some of it is that they’ve been playing u14s up with the u15 team, particularly in the second half of the season. But, looking at the numbers, more than 40% of the overall downward trend was driven by a week over week decline on the offensive side.
This trend was at its worst in a four-game stretch that ran from late January through the end of March and was bookended by a 1-1 tie against the Nomads on January 26th in game 12 and 2-0 win to RSC in game 15 on March 2nd.
LAFC’s offense bottomed out with the 0-2 loss to FCG on March 23rd, and after that point, the offense took a significant step up for the next four games, with LAFC outscoring opponents 20-2.
But, even with that late improvement, LAFC’s offense - playing about 4x worse by May 19th – outweighed LAFC’s consistently good defense and resulted in LAFC being about 2.5x less competitive overall than they were at the beginning of the season.
Here’s the u15 LAFC goal differential % over time chart:
Since this is likely controversial, am also including the u15 LAFc goal scoring % over time (i.e. offense effectiveness) chart:
Least Improved u15 #2: LA Galaxy San Diego
LAGSD actually had solid improvement in the 2018 part of the season, peaking with a 3-2 win over LAUFA in mid-November. The improvement was driven primarily by significant progress on the offensive side of the ball, with the start of the improvement coming after after their sixth match, a 0-3 loss to the Strikers. LAGSD also had some improvement defensively in that same time period.
After LAGSD returned from the winter break, it was a different story, and LAGSD’s offense and defense gave back their improvements and both returned to their poor previous form.
As of May 19th, LAGSD was about 2x less competitive relative to their peers than they were at the beginning of the season.
Here’s the u15 LAGSD goal differential % over time chart:
Least Improved u15 #3: San Diego Surf
San Diego Surf started very strong with a 10-0 win over Arsenal but then immediately followed that with 1-1 tie against LAUFA. And so their season went…
If the win against Arsenal is not included, the SD Surf are a story of improvement that peaked in late March, with a 4-1 win over De Anza, that was then followed by a sustained decline in performance in April and May. Both the improvement and decline were driven primarily by a similar improvement and then decline on the offensive side.
Defensively, the SD Surf was consistent for most of the season with a 2-5 loss to Barca being the most significant outlier.
It should be noted that then SD Surf coach Benoit David announced his departure from the Surf club to join LAFC at the end of February. Although SD Surf looks like they initially shrugged off the announcement, it’s reasonable to assume that the announcement had an impact.
As of May 19th, the SD Surf was about 50% less competitive relative to their peers than they were at the beginning of the season.
Here’s the u15 SD Surf goal differential % over time chart:
__________
Here’s the short version on the methodology for comparing teams. It’s the same algo being used to predict match results can also be used to track team progress relative to their peer group over time.
This progress tracking is calculated as:
the % of goals scored vs average goals allowed by each opponent (i.e. goal scoring effectiveness % per game)
minus
the % of goals allowed vs average goals scored by each opponent (i.e. goals defending % per game)
equals
goal differential % per game, which can be charted for each game to show improvement or decline trends over time.
If there’s a need for/interest in more detail or other questions, just ping over or reply to this post.