
Kante
PREMIER
The season’s coming to a close, and clubs and families are making decisions about next year. So, here’s some data on the three most improved u13 teams - and the three least improved teams – through May 12th.
The goal of this (long) post is to provide some objective data for evaluating DA team results over the 2018-19 season. Usually, families and coaches will have some intuitive sense of how things are trending but it's hard to be concrete.
Will leave it to the clubs and families to interpret on whether or not the improvements or declines were due to development over time (i.e. good or bad coaching) or other reasons.
If your team is not listed below or is another age group or gender but you are interested in how they’re doing, send a note and will send over the requested team chart(s).
The short version on the methodology for comparing teams is that it's the same algo being used to predict match results can also be used to track team progress relative to their peer group over time. This progress tracking is calculated as:
If there’s a need for/interest in more detail or other questions, just ping over or reply to this post.
_______
Most Improved #1: Nomads
The Nomads started off solid with 3-3 draw against OC Surf, but then took a left turn losing the next three matches against LAGSD 0-7, SDSC 0-4 and the Strikers 0-3.
About ten games into the season, things started to turn around with the Nomads rematch against LAGSD for a 1-3 result. The improvement seems to have been fairly sharp, which would typically indicate that the Nomads added players post-showcase but, per the game reports, that doesn’t seem to be the case.
The improved performance was largely driven by a slow start to the season and the Nomads then improving defensively. The Nomads are now about 3x more competitive with their peers than they were at the start of the season. Well done.
Here’s the u13 Nomads goal differential % over time chart:

Most Improved #2: FC Golden State
FC Golden State also had a tough start/schedule to the 2018-19 season, playing LAFC in the first game of the season for a 0-6 result and then following that match with a 1-6 loss to LA Premier.
Defensively, FC Golden State made a positive change after 10th game of the season which then led to a more reasonable 0-3 result against LAFC in their re-match, and maintained this defensive improvement for most of the rest of the season.
Offensively, it took FC Golden State longer to improve, but after about 20 games, they did take a sustained step up in goal scoring, putting in their first two goals against TFA for a respectable 2 to 4 result, and then followed that with 3-1 result against LA Premier and 2-2 tie with the Pateadores.
As of May 12th, FC Golden State is now more than 2x more competitive with their peers than they were at the start of the season.
Here’s the u13 FC Golden State goal differential % over time chart:

Most Improved #3: Albion
Typically, wouldn’t call out one player as the primary reason for a team’s improvement but Albion is a clear-cut exception this year.
Albion’s improvement in 2018-19 has been largely due to the better utilization of one player, JL, after about the 11th game.
Although JL has 22 goals over 26 games so far this season, 2/3’s of his goal production are the 16 goals he’s scored in Albion’s last 12 games. For those playing along at home, that's about 1.3 goals per game in the last 12 matches vs about .5 goals per game in the first 14 matches. And, as JL has started scoring significantly more goals, so have other Albion players but to a lesser degree.
Defensively, Albion took a hit in games 11 thru 17, and best guess is that Albion moved JL forward from the defensive line which caused the issue. Albion solved this problem starting game 18 and brought the goals allowed % back to a respectable number at that point.
As of May 12th, Albion is now about 2x more competitive with their peers than they were at the beginning of the season.
Here’s u13 Albion’s goal differential % over time chart:

_____
Least Improved #1: LA Galaxy
For the 2018-19 season, the u13 LA Galaxy team was the least improved squad in SoCal.
Some of LA Galaxy’s dip is due to, after the showcase, playing some 2007s up but, looking at the game reports, it was primarily three players who played up, and this explains only a small portion of LA Galaxy’s decline over the course of the season.
LA Galaxy declined on both sides of the ball with goal scoring and goals allowed measurably worse relatively to their peer group since the beginning of the season.
All said, as of this last weekend, LA Galaxy is almost 3x worse relative to their peers than they were at the beginning of the season.
It will be interesting to see how the LA Galaxy go about assembling a roster for the 2019-20 season. Last year after the 2017-18 season, LA Galaxy recruited in 10 new players from other academy teams, effectively replacing half the roster for the upcoming 2018-19 season.
Here’s u13 LA Galaxy’s goal differential % over time chart:

Least Improved #2: San Diego Soccer Club
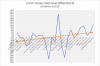
SDSC started 2018-19 strong with four straight wins by a combined 16 to 3 score line, but SDSC trended mostly worse from that point forward.
Should be noted that along the way, SDSC did have some notable matches that bucked the downward trend including a November 3-0 win over OC Surf, and tight 2-3 December loss to the Strikers and 8-2 win over Albion.
It should also be said that SDSC is relatively new to DA and that it is generally is tough for new clubs to demonstrate sustained improvement week in and week out over a long season. And that with such a strong start, they had a tough compare for the rest of the season.
As of May 12th, SDSC were about 50% worse relative to their peers than they were at the beginning of the season.
Here’s u13 SDSC’s goal differential % over time chart:

Least Improved #3: LA Galaxy San Diego
After a tough first game of the season 1-7 loss to SDSC, LAGSD rallied with four straight wins – including a 3-0 win over SD Surf – by a combined score of 15-2.
LAGSD then hit a bump in the road with 0-5 loss to the Strikers and never quite got back on track after that.
LAGSD’s decline can mostly be chalked up to poor late season defense in April and May when they gave up an average of about four goals per game vs the period from Sept thru March when they only gave up an average of about 1.5 goals per game.
Also, should be noted that with such a strong start, LAGSD had a tough compare for the rest of the season.
Here’s u13 LAGSD’s goal differential % over time chart:

The goal of this (long) post is to provide some objective data for evaluating DA team results over the 2018-19 season. Usually, families and coaches will have some intuitive sense of how things are trending but it's hard to be concrete.
Will leave it to the clubs and families to interpret on whether or not the improvements or declines were due to development over time (i.e. good or bad coaching) or other reasons.
If your team is not listed below or is another age group or gender but you are interested in how they’re doing, send a note and will send over the requested team chart(s).
The short version on the methodology for comparing teams is that it's the same algo being used to predict match results can also be used to track team progress relative to their peer group over time. This progress tracking is calculated as:
- the % of goals scored vs average goals allowed by each opponent (i.e. goal scoring effectiveness % per game)
- the % of goals allowed vs average goals scored by each opponent (i.e. goals defending % per game)
- goal differential % per game, which can be charted for each game to show improvement or decline trends over time.
_______
Most Improved #1: Nomads
The Nomads started off solid with 3-3 draw against OC Surf, but then took a left turn losing the next three matches against LAGSD 0-7, SDSC 0-4 and the Strikers 0-3.
About ten games into the season, things started to turn around with the Nomads rematch against LAGSD for a 1-3 result. The improvement seems to have been fairly sharp, which would typically indicate that the Nomads added players post-showcase but, per the game reports, that doesn’t seem to be the case.
The improved performance was largely driven by a slow start to the season and the Nomads then improving defensively. The Nomads are now about 3x more competitive with their peers than they were at the start of the season. Well done.
Here’s the u13 Nomads goal differential % over time chart:
Most Improved #2: FC Golden State
FC Golden State also had a tough start/schedule to the 2018-19 season, playing LAFC in the first game of the season for a 0-6 result and then following that match with a 1-6 loss to LA Premier.
Defensively, FC Golden State made a positive change after 10th game of the season which then led to a more reasonable 0-3 result against LAFC in their re-match, and maintained this defensive improvement for most of the rest of the season.
Offensively, it took FC Golden State longer to improve, but after about 20 games, they did take a sustained step up in goal scoring, putting in their first two goals against TFA for a respectable 2 to 4 result, and then followed that with 3-1 result against LA Premier and 2-2 tie with the Pateadores.
As of May 12th, FC Golden State is now more than 2x more competitive with their peers than they were at the start of the season.
Here’s the u13 FC Golden State goal differential % over time chart:
Most Improved #3: Albion
Typically, wouldn’t call out one player as the primary reason for a team’s improvement but Albion is a clear-cut exception this year.
Albion’s improvement in 2018-19 has been largely due to the better utilization of one player, JL, after about the 11th game.
Although JL has 22 goals over 26 games so far this season, 2/3’s of his goal production are the 16 goals he’s scored in Albion’s last 12 games. For those playing along at home, that's about 1.3 goals per game in the last 12 matches vs about .5 goals per game in the first 14 matches. And, as JL has started scoring significantly more goals, so have other Albion players but to a lesser degree.
Defensively, Albion took a hit in games 11 thru 17, and best guess is that Albion moved JL forward from the defensive line which caused the issue. Albion solved this problem starting game 18 and brought the goals allowed % back to a respectable number at that point.
As of May 12th, Albion is now about 2x more competitive with their peers than they were at the beginning of the season.
Here’s u13 Albion’s goal differential % over time chart:
_____
Least Improved #1: LA Galaxy
For the 2018-19 season, the u13 LA Galaxy team was the least improved squad in SoCal.
Some of LA Galaxy’s dip is due to, after the showcase, playing some 2007s up but, looking at the game reports, it was primarily three players who played up, and this explains only a small portion of LA Galaxy’s decline over the course of the season.
LA Galaxy declined on both sides of the ball with goal scoring and goals allowed measurably worse relatively to their peer group since the beginning of the season.
All said, as of this last weekend, LA Galaxy is almost 3x worse relative to their peers than they were at the beginning of the season.
It will be interesting to see how the LA Galaxy go about assembling a roster for the 2019-20 season. Last year after the 2017-18 season, LA Galaxy recruited in 10 new players from other academy teams, effectively replacing half the roster for the upcoming 2018-19 season.
Here’s u13 LA Galaxy’s goal differential % over time chart:
Least Improved #2: San Diego Soccer Club
SDSC started 2018-19 strong with four straight wins by a combined 16 to 3 score line, but SDSC trended mostly worse from that point forward.
Should be noted that along the way, SDSC did have some notable matches that bucked the downward trend including a November 3-0 win over OC Surf, and tight 2-3 December loss to the Strikers and 8-2 win over Albion.
It should also be said that SDSC is relatively new to DA and that it is generally is tough for new clubs to demonstrate sustained improvement week in and week out over a long season. And that with such a strong start, they had a tough compare for the rest of the season.
As of May 12th, SDSC were about 50% worse relative to their peers than they were at the beginning of the season.
Here’s u13 SDSC’s goal differential % over time chart:
Least Improved #3: LA Galaxy San Diego
After a tough first game of the season 1-7 loss to SDSC, LAGSD rallied with four straight wins – including a 3-0 win over SD Surf – by a combined score of 15-2.
LAGSD then hit a bump in the road with 0-5 loss to the Strikers and never quite got back on track after that.
LAGSD’s decline can mostly be chalked up to poor late season defense in April and May when they gave up an average of about four goals per game vs the period from Sept thru March when they only gave up an average of about 1.5 goals per game.
Also, should be noted that with such a strong start, LAGSD had a tough compare for the rest of the season.
Here’s u13 LAGSD’s goal differential % over time chart:
Attachments
Last edited: