Updated 12/18: Improvement/Decline by 05 LA/SD Teams: Offense y2y

Kante

PREMIER
Apologies for the length of the post and congrats to folks who make it all the way through. Below are the 2018-19 vs 2017-18 offensive comparative improvements or declines by team ytd this year (Sept thru Dec) vs same period last year.

Am using a algorithm called Goal Scoring % (GSP) to make the comparison between teams. This metric enables a mostly accurate look at how teams are likely to perform in future matches. Have been using to create match result predictions for 06, 05 and 04 matches and the algo has been getting pretty accurate.


If anyone has questions or wants more info on these types of metrics, here’s a post which explains in more detail.

http://www.socalsoccer.com/threads/how-to-objectively-best-measure-development.15976/

Here’s teams sorted by most to least improved offensively in 2018-19 vs 2017-18, for matches played Sept 1 thru Dec 9. Sample size is about ten matches for most teams.

upload_2018-12-13_9-54-2.png

Here’s which teams added what # of players for the new 2018-19 season.

upload_2018-12-13_9-54-27.png

When you look at both charts – offensive improvement and # of players added – there’s an interesting inverse relationship between the # of players being added to a team and to the degree to which they improved (or did not improve) offensively y2y, particularly if you remove LA Galaxy and LAFC as anomalies.

Would argue that LAG is an anomaly because of the degree to which they replaced their 2017-18 team by recruiting players from other academies (most teams don’t have this kind of recruiting muscle). LAFC is an anomaly because of the drop-off after their 12 month run of wins.

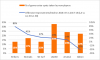
Here’s a chart comparing the # of players added to offensive improvement/decline without LA Galaxy and LAFC. It’s a little busy, but the short version is that there’s a decent correlation between adding a new player and a decline in offensive effectiveness the more players a team adds.

upload_2018-12-13_9-55-1.png

Running the stats, the correlation shows that the adding new players drives about 30% of the variation in y2y offensive effectiveness improvement/decline, and could be the driver behind an average -13% decline in offensive effectiveness for each new player added.

Put more simply, according to the numbers, maintaining and developing the bulk of a team's players over time looks like it is more be a more effective way to improve your offense than wholesale recruiting/adding in new players.

Intuitively, this makes sense, and there's some numbers to back this up.
 
Interesting. However, one would need to take into account when players have been added (beginning of the season or recently; or some might have joined last year but never played a game) in order to really measure the strength of this correlation. I would also think that the types of players added (defense, midfield and offense) might matter as well. Could the change in coaching matter more? What about the physical development of players? Not trying to give you a hard time as it is interesting but more factors could probably be included. Nevertheless, thank you...
 
Interesting. However, one would need to take into account when players have been added (beginning of the season or recently; or some might have joined last year but never played a game) in order to really measure the strength of this correlation. I would also think that the types of players added (defense, midfield and offense) might matter as well. Could the change in coaching matter more? What about the physical development of players? Not trying to give you a hard time as it is interesting but more factors could probably be included. Nevertheless, thank you...
No worries. Thanks for the feedback. Glad the post is prompting some comments. That's how this stuff gets figured out.

On your pts:

  • With my data, I didn't count players listed on the roster but who hadn't played a game.
Was fairly easy to filter out except where Nomads, Albion and SD Surf all listed a specific player as being on their roster. In actuality, he moved from Albion to SD Surf, so had some scrubbing to do there.
  • Have glanced to see how many new players joined after 9/1. Fair pt on that item.
At a glance, most teams who added a player after the start of season only added one or two players, and did so relatively early on. FCG, I think, is the one exception and they added a number of players well into the season, so that will affect the stats. Will review that this weekend and update then.
  • Hard to tell types of players from the public USSDA info. Many public roster positions are not correct and can only work with what's available.
  • ID/ing impact of coaching changes would be interesting (if a little sensitive) and is do-able, I think. Weekend item.
  • On physical development, that would be a tough one to take into consideration other than to say that there might be multiple causes for improvement where teams did not add new players.
At a glance, there's a couple of players on Strikers who I think played 04 last year and have been playing 05 this year, so that kind of data might be a way to estimate... Will mull. Weekend item.
 
I would imagine that you would also have to, if you haven't already, take in consideration that teams aren't playing 1/2 the competition that they played last year. Surf is dominating in SD, would their offensive improvement be that great if they were playing against the better competition that is found in the LA region?? I would venture to say it would make a big difference.
 
I would imagine that you would also have to, if you haven't already, take in consideration that teams aren't playing 1/2 the competition that they played last year. Surf is dominating in SD, would their offensive improvement be that great if they were playing against the better competition that is found in the LA region?? I would venture to say it would make a big difference.
LA Region better competition??
LAFC,LA Galaxy TFA and who else?
have you checked the results from the showcase?
SD teams dominated the showcase
 
LA Region better competition??
LAFC,LA Galaxy TFA and who else?
have you checked the results from the showcase?
SD teams dominated the showcase

Yes, there is better competition in the LA region for Surf, that is who I was talking about in my post. And no I have not checked the showcase results because really it's not that important to me.

My post was really more about the accuracy results in the OP. If 4 or 5 of Surf's games in the first half of the season were against the top of the LA teams, their stats would most likely be different. That's all I'm saying.
LA has only 2 top teams that would be the only competition for surf
LA doesn’t have 4-5 top teams
Bottom line splitting the regions killed the competition for all wetther top or average teams
 
LA has only 2 top teams that would be the only competition for surf
LA doesn’t have 4-5 top teams
Bottom line splitting the regions killed the competition for all wetther top or average teams

When I say the 'top 4-5 teams', I'm talking about the top 4-5 teams in the standings. I never said that LA has THE top 4-5 teams. No need to read so defensively into my post.

Back to the OP of data and graphs. The graphs are sorted by most to least improved offensively in 2018-19 vs 2017-18. All but one San Deigo team are on the left side of the graph. All but one LA team are on the other side of the graph. Why? Because the LA region added more players to their rosters than the SD region as the OP mentioned? I challenge that and say it's because the competition is different.
Was not taken defensively
Rather literally
But anyways back to OP
 
I would imagine that you would also have to, if you haven't already, take in consideration that teams aren't playing 1/2 the competition that they played last year. Surf is dominating in SD, would their offensive improvement be that great if they were playing against the better competition that is found in the LA region?? I would venture to say it would make a big difference.

So, first, determining which group is more competitive in 2018-19 is a whole discussion by itself, which, looking at some of the data, is more complicated than just looking at the showcase results.

Here's quick two cents on how splitting the groups affected the y2y comparison. am focusing on 2017-18 season which was the baseline used for the comparison.

First off, good catch/point on the SD vs LA distribution by defensewins.

Due to dw's post, looked at the whole season of 2017-18 offense goal scored % when SD teams played LA teams, and found that, on average, SD teams scored -14% fewer goals than expected against LA teams in 2017-18.

Also, USSDA scheduled significantly more LA vs SD matches between 9/1/17 and 12/16/17 than they did later in the season last year. For example, LAFC played SD teams in 6 out of its first 9 games in 2017.

Translation:
1) Yes, SD teams, on average, were worse offensively against LA teams last year
2) USSDA scheduling more LA vs SD games btw 9/1/17 and 12/16/17 skewed SD team goal scoring % lower for the purposes of the comparison (which only covered 9/1 thru 12/16), leading to an easier compare for SD teams, which then led to an artificially higher GS% improvement in 2018-19 for SD teams.

Will take a look at how to correct for this and the other good points raised/questions asked later this weekend.
 
Last edited:
What might be interesting (more work for you :)) ... if could add couple of other groups (ex: from Texas, Northeast, etc.) into the mix.

would be interesting to see how other teams are developing in the same time period.
 
What might be interesting (more work for you :)) ... if could add couple of other groups (ex: from Texas, Northeast, etc.) into the mix.

would be interesting to see how other teams are developing in the same time period.
am looking at possibly doing that but it might be on a dedicated site. doing this look at numbers for multiple groups looks like it could be valuable for both socal and the other groups but would be a fair amount of effort that goes above being a hobby (so my wife tells me...;))
 
Last edited:
Ok, incorporated some of the feedback that came in. There were some good points, particularly on the importance of comparing SD to SD and LA to LA, and not overcounting new players who had only recently been added to a roster.

Here's first chart revision. This is the adjusted offensive y2y improvement/decline. The orange line is the original and the blue line is the adjusted looking only at SD vs SD and LA vs LA in 2017-18 as the baseline for the comparison.

For example, SD Surf when their 2018-19 stats are compared against how they did against SD team in 2017-18, the SD Surf only improved their offense +27% in 2018-19, not +133%. Again, thanks to defensewins for the input.


upload_2018-12-17_14-28-21.png

Next, Mid10 pointed out that only counting new players added might be misleading when looking at roster churn vs improvement/decline in offensive effectiveness and that, for example, a player added at game 10 would count the same as a player added at the beginning of the new season. Fair point.

So, instead of just counting new players, looked at game roster spots taken up by new players as % of total game roster spots. This info is easily available from the game cards (who's rostered/not rostered) and appropriately weighs a new player who started at the beginning of the season with 10 games rostered and a new player who only just started in game 10 as one game rostered, in relative terms.

Here's second chart revision. It's pretty close to the original which just counted new players but some differences.

upload_2018-12-17_14-47-43.png


Here's the final chart revisions then with % of game roster spots taken by new players charted against adjusted offensive improvement/decline comparing 2018-19 compared to 2017-18 (LA vs LA; SD vs SD).

What's interesting is that are two different trends for the two different regional groups.

In San Diego, adding new players (as measured by % of game roster spots taken by new players) is negatively correlated with offensive improvement i.e. adding new players has led, so far this season, to worse offensive performance in San Diego. To be fair, it's not a huge correlation but it's there.

Having said that, there are some anomalies to be aware of. For example, the Strikers have two bio-banded 04 players rostered on their 05 team - one of whom is active and one who is injured but was rostered for four games - and also have two 05 players who played a bit with the 05 team last year but played the majority of their matches for the 04 team.

One of these 05's was rostered for one group game Sept thru Dec last year with zero goals but in 2018-19 has been rostered for seven of eight group matches with 5 goals.

So, again, nothing wrong with either of these items but there is some impact on y2y offensive improvement.

Here's the chart for San Diego teams:

upload_2018-12-17_15-52-54.png


In Los Angeles, on the other hand, there's a strong positive correlation between adding players and an offensive improvement (which is different than what I originally posted - mea culpa).

Adding new players drives about 25% of the variation in y2y offensive effectiveness improvement/decline, and one new player added at the start of the season on an 18 person roster could be the driver of about an average +12% y2y improvement in offensive effectiveness. The exception here is LAUFA which had to replace four key players recruited to LA Galaxy.

Here's the chart:
upload_2018-12-17_16-12-4.png

All said, head hurts now. And there was definitely a correlation between head hurting and this post. But hope this is helpful.

As an fyi, I glanced at whether or not coaches had changed y2y but at a glance I only saw coaching changes at LA Galaxy and FC Golden State. If there's other teams that had coaching changes y2y, please let me know.


Attachments

  • upload_2018-12-17_15-39-7.png
    upload_2018-12-17_15-39-7.png
    52.2 KB · Views: 3
Last edited:
Kante

Just to get your numbers correct on Strikers...There's only one 04 player(Bio Banded) actually playing, the other one has been hurt since the start of the season and will not play this year...Only one 05 player that played 3 games as an 04 last year but also got injured and missed all of last season...The other 05 player only featured in showcases for the DA purposes...
So those numbers should be considered as true without any curve or advantage.....
Got it. Thx for the clarification. Have made updates to the original post to reflect the new info.

The game cards show one of the 05's who played up last year - #48 - as rostered this year for seven of eight 05/u14 group matches and scoring five goals in three of those matches.
Of the +83% total 2018-19 Strikers' offensive improvement, #48's goals drove +31% of that improvement number, and the active 04 - with three goals so far in 2018-19 in group play - drove another +13% offensive improvement.

The other 05 was only rostered for one group match this year (vs Arsenal) with no goals scored but it sounds like that was a record keeping mistake.

Again, thanks for the info. I updated my post w/ the new info.
 
Back
Top